Remote Debugging With Eclipse + WebSphere 7
So far, there is still lack of WebSphere 7 plugin for both Eclipse and NetBeans IDE. However, you are able to debug your web application via Java Debugger (jdb).
Here’s a guide to show you how to remote debugging your web application in Eclipse and WebSphere via Java Debugger (jdb).
Eclipse <----> Java Debugger (jdb) <----> WebSphere 7
1. Enable WebSphere in Debug Mode
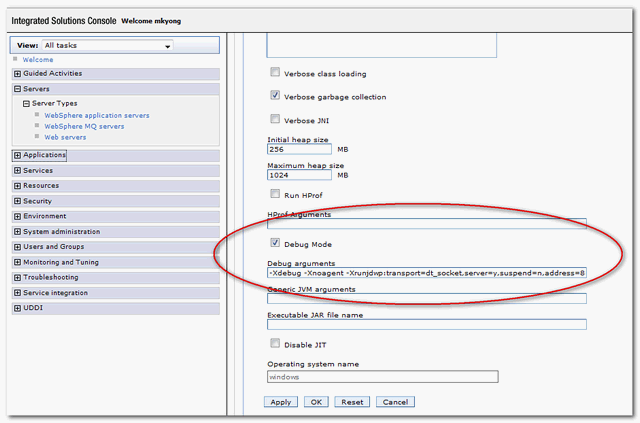
In WebSphere web console, left navigation,
1. Servers –> Server Types –> WebSphere application servers
2. Under Server Infrastructure section –> expand Java and Process Management –> Process definition
3. Under Additional Properties section –> click Java Virtual Machine
4. Checked the “Debug Mode”
5. In Debug arguments textbox, put this
2. Under Server Infrastructure section –> expand Java and Process Management –> Process definition
3. Under Additional Properties section –> click Java Virtual Machine
4. Checked the “Debug Mode”
5. In Debug arguments textbox, put this
-Xdebug -Xnoagent -Xrunjdwp:transport=dt_socket,server=y,suspend=n,address=8888
6. Restart WebSphere server instance.

Now, WebSphere is started in debug mode, and listening on port 8888. (Later, Eclipse will connect to this port for debugging)
2. Install or deploy web application to WebSphere
“war” your web application, install (first-time) or deploy it to WebSphere. And start your web application in WebSphere.
3. Eclipse’s Java Debugger (jdb)
In Eclipse IDE, under your project source
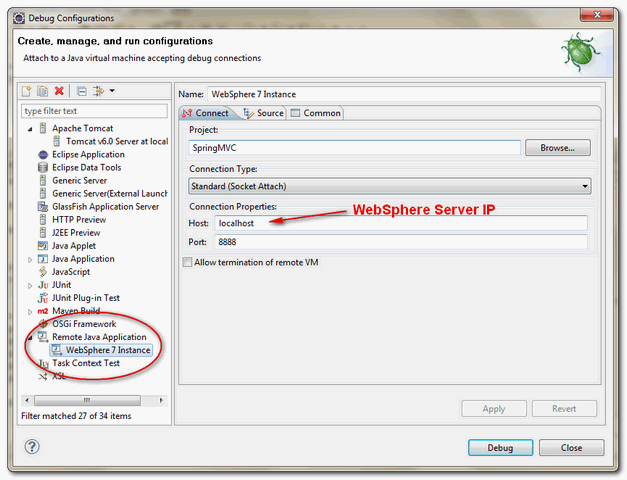
1. Click on “Run”, “Debug Configurations…”
2. Select “Remote Java Application”, right click and select “New”
3. Renamed a new name , e.g “WebSphere 7 Instance”
4. In “Connection Type”, select default, “Standard (Socket Attached)”
5. Host, put your WebSphere host IP
6. Port, put 8888.
2. Select “Remote Java Application”, right click and select “New”
3. Renamed a new name , e.g “WebSphere 7 Instance”
4. In “Connection Type”, select default, “Standard (Socket Attached)”
5. Host, put your WebSphere host IP
6. Port, put 8888.

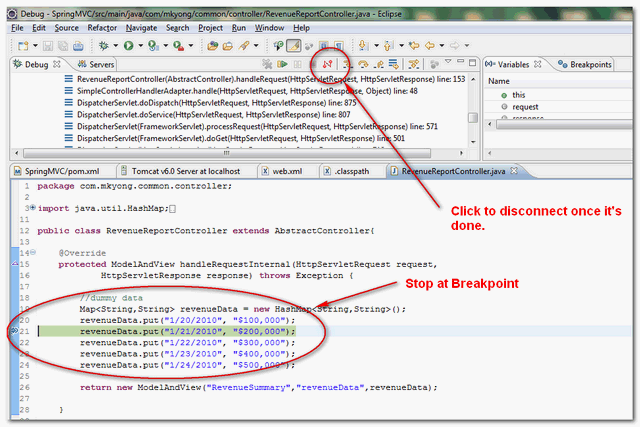
7. Click on the debug button.
Now, Eclipse debugger is started and connected to port 8888.
4. Debugging, see result!
Open your favor browser, and type your web application URL. Now, Eclipse will stop at your predefined breakpoint.

Done.
Note
This Java Debugger (jdb) solution is able to apply on most of the Java Application Servers, like JBoss, WebLogic, or even in Servlet Container like Tomcat. The only problem in this method is, you have to make sure the deployed web application is synchronize with Eclipse’s debugging source code.
This Java Debugger (jdb) solution is able to apply on most of the Java Application Servers, like JBoss, WebLogic, or even in Servlet Container like Tomcat. The only problem in this method is, you have to make sure the deployed web application is synchronize with Eclipse’s debugging source code.
1 comment:
yeezy sneakers
basketball shoes
michael kors factory outlet
fitflops sale clearance
air jordan retro
links of london sale
cheap uggs
discount sunglasses
cheap nfl jerseys
true religion sale
michael kors handbags
http://www.raybanglasses.in.net
tiffany jewellery
ralph lauren polo shirts
nike dunks
tiffany online
oakley store online
oakley sunglasses,oakley outlet sunglasses
cheap real jordans
adidas nmd
ray ban uk,cheap ray ban sunglasses
Post a Comment