Financial ratio

| Accountancy | |
|---|---|
| Key concepts | |
| Accountant · Accounting period · Bookkeeping ·Cash and accrual basis · Cash flow management ·Chart of accounts · Constant Purchasing Power Accounting · Cost of goods sold · Credit terms ·Debits and credits · Double-entry system · Fair value accounting · FIFO & LIFO · GAAP / IFRS ·General ledger · Goodwill · Historical cost ·Matching principle · Revenue recognition · Trial balance | |
| Fields of accounting | |
| Cost · Financial · Forensic · Fund · Management ·Tax | |
| Financial statements | |
| Statement of Financial Position · Statement of cash flows · Statement of changes in equity · Statement of comprehensive income · Notes · MD&A · XBRL | |
| Auditing | |
| Auditor's report · Financial audit · GAAS / ISA ·Internal audit · Sarbanes–Oxley Act | |
| Accounting qualifications | |
| CA · CPA · CCA · CGA · CMA · CAT | |
A financial ratio (or accounting ratio) is a relative magnitude of two selected numerical values taken from an enterprise's financial statements. Often used in accounting, there are many standard ratios used to try to evaluate the overall financial condition of a corporation or other organization. Financial ratios may be used by managers within a firm, by current and potential shareholders (owners) of a firm, and by a firm's creditors. Security analysts use financial ratios to compare the strengths and weaknesses in various companies.[1] If shares in a company are traded in a financial market, the market price of the shares is used in certain financial ratios.
Ratios can be expressed as a decimal value, such as 0.10, or given as an equivalent percent value, such as 10%. Some ratios are usually quoted as percentages, especially ratios that are usually or always less than 1, such as earnings yield, while others are usually quoted as decimal numbers, especially ratios that are usually more than 1, such as P/E ratio; these latter are also called multiples. Given any ratio, one can take its reciprocal; if the ratio was above 1, the reciprocal will be below 1, and conversely. The reciprocal expresses the same information, but may be more understandable: for instance, the earnings yield can be compared with bond yields, while the P/E ratiocannot be: for example, a P/E ratio of 20 corresponds to an earnings yield of 5%.
Contents |
Sources of data for financial ratios
Values used in calculating financial ratios are taken from the balance sheet,incomeStatement, statement of cash flows or (sometimes) thestatement of retained earnings. These comprise the firm's "accounting statements" or financial statements. The statements' data is based on the accounting method and accounting standards used by the organization.
Purpose and types of ratios
Financial ratios quantify many aspects of a business and are an integral part of the financial statement analysis. Financial ratios are categorized according to the financial aspect of the business which the ratio measures.Liquidity ratios measure the availability of cash to pay debt.[2] Activity ratios measure how quickly a firm converts non-cash assets to cash assets.[3] Debt ratios measure the firm's ability to repay long-term debt.[4]Profitability ratios measure the firm's use of its assets and control of its expenses to generate an acceptable rate of return.[5] Market ratios measure investor response to owning a company's stock and also the cost of issuing stock.[6] These are concerned with the return on investment for shareholders, and with the relationship between return and the value of an investment in company’s shares.
Financial ratios allow for comparisons
- between companies
- between industries
- between different time periods for one company
- between a single company and its industry average
Ratios generally hold no meaning unless they are benchmarked against something else, like past performance or another company. Thus, the ratios of firms in different industries, which face different risks, capital requirements, and competition are usually hard to compare.
Accounting methods and principles
Financial ratios may not be directly comparable between companies that use different accounting methods or follow various standard accounting practices. Most public companies are required by law to use generally accepted accounting principles for their home countries, but private companies, partnerships and sole proprietorships may not use accrual basis accounting. Large multi-national corporations may use International Financial Reporting Standards to produce their financial statements, or they may use the generally accepted accounting principles of their home country.
There is no international standard for calculating the summary data presented in all financial statements, and the terminology is not always consistent between companies, industries, countries and time periods.
Abbreviations and terminology
Various abbreviations may be used in financial statements, especially financial statements summarized on the Internet. Sales reported by a firm are usually net sales, which deduct returns, allowances, and early payment discounts from the charge on an invoice. Net income is always the amount after taxes, depreciation, amortization, and interest, unless otherwise stated. Otherwise, the amount would be EBIT, or EBITDA (see below).
Companies that are primarily involved in providing services with labour do not generally report "Sales" based on hours. These companies tend to report "revenue" based on the monetary value of income that the services provide.
Note that Shareholder's Equity and Owner's Equity are not the same thing, Shareholder's Equity represents the total number of shares in the company multiplied by each share's book value; Owner's Equity represents the total number of shares that an individual shareholder owns (usually the owner with controlling interest), multiplied by each share's book value. It is important to make this distinction when calculating ratios.
Other abbreviations
(Note: These are not ratios, but values in currency.)
- COGS = Cost of goods sold, or cost of sales.
- EBIT = Earnings before interest and taxes
- EBITDA = Earnings before interest, taxes, depreciation, and amortization
- EPS = Earnings per share
Ratios
Profitability ratios
Profitability ratios measure the company's use of its assets and control of its expenses to generate an acceptable rate of return
- Gross margin, Gross profit margin or Gross Profit Rate[7][8]

- OR

- Operating margin, Operating Income Margin, Operating profit margin or Return on sales (ROS)[8][9]
- Note: Operating income is the difference between operating revenues and operating expenses, but it is also sometimes used as a synonym for EBIT and operating profit.[10] This is true if the firm has no non-operating income. (Earnings before interest and taxes / Sales[11][12])

- Profit margin, net margin or net profit margin[13]

- Return on equity (ROE) [13]

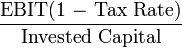
- Return on investment (ROI ratio or Du Pont Ratio)[6]

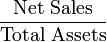
- Return on assets (ROA)[14]

- Return on assets Du Pont (ROA Du Pont)[15]

- Return on Equity Du Pont (ROE Du Pont)

- Return on net assets (RONA)
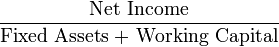
- Return on capital (ROC)
- Risk adjusted return on capital (RAROC)

- OR

- Return on capital employed (ROCE)

- Note: this is somewhat similar to (ROI), which calculates Net Income per Owner's Equity
- Cash flow return on investment (CFROI)


Liquidity ratios
Liquidity ratios measure the availability of cash to pay debt.
- Operation cash flow ratio


Activity ratios (Efficiency Ratios)
Activity ratios measure the effectiveness of the firms use of resources.


- Stock turnover ratio[20][21]


- Inventory conversion ratio[4]

- Inventory conversion period (essentially same thing as above)

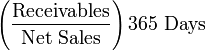
- Receivables conversion period
- Payables conversion period
- Cash Conversion Cycle
- Inventory Conversion Period + Receivables Conversion Period - Payables Conversion Period

Debt ratios (leveraging ratios)
Debt ratios measure the firm's ability to repay long-term debt. Debt ratios measure financial leverage.


- Long-term Debt to equity (LT Debt to Equity)[24]


Market ratios
Market ratios measure investor response to owning a company's stock and also the cost of issuing stock. These are concerned with the return on investment for shareholders, and with the relationship between return and the value of an investment in company’s shares.
- Earnings per share (EPS)[25]


- Dividend cover (the inverse of Payout Ratio)


- Cash flow ratio or Price/cash flow ratio[27]

- Price to book value ratio (P/B or PBV)[27]


Other Market Ratios


Sector-specific ratios
Capital Budgeting Ratios
In addition to assisting management and owners in diagnosing the financial health of their company, ratios can also help managers make decisions about investments or projects that the company is considering to take, such as acquisitions, or expansion.
Many formal methods are used in capital budgeting, including the techniques such as
- Net present value
- Profitability index
- Internal rate of return
- Modified Internal Rate of Return
- Equivalent annuity
See also
References
- ^ Groppelli, Angelico A.; Ehsan Nikbakht (2000).Finance, 4th ed. Barron's Educational Series, Inc.. pp. 433. ISBN 0764112759.
- ^ Groppelli, p. 434.
- ^ a b c Groppelli, p. 436.
- ^ a b Groppelli, p. 439.
- ^ Groppelli, p. 442.
- ^ a b Groppelli, p. 445.
- ^ Williams, P. 265.
- ^ a b Williams, p. 1094.
- ^ Williams, Jan R.; Susan F. Haka, Mark S. Bettner, Joseph V. Carcello (2008). Financial & Managerial Accounting. McGraw-Hill Irwin. pp. 266. ISBN 9780072996500.
- ^http://www.investorwords.com/3460/operating_income.htmlOperating income definition
- ^ Groppelli, p. 443.
- ^ Bodie, Zane; Alex Kane and Alan J. Marcus (2004). Essentials of Investments, 5th ed. McGraw-Hill Irwin. pp. 459. ISBN 0072510773.
- ^ a b Groppelli, p. 444.
- ^ Professor Cram. "Ratios of Profitability: Return on Assets" College-Cram.com. 14 May 2008
- ^ Professor Cram. "Ratios of Profitability: Return on Assets Du Pont" College-Cram.com. 14 May 2008
- ^ Weston, J. (1990). Essentials of Managerial Finance. Hinsdale: Dryden Press. p. 295.ISBN 0030307333.
- ^ a b c Groppelli, p. 435.
- ^ Houston, Joel F.; Brigham, Eugene F. (2009).Fundamentals of Financial Management. [Cincinnati, Ohio]: South-Western College Pub. p. 90. ISBN 0-324-59771-1.
- ^ Bodie, p. 459.
- ^ Groppelli, p. 438.
- ^ Weygandt, J. J., Kieso, D. E., & Kell, W. G. (1996). Accounting Principles (4th ed.). New York, Chichester, Brisbane, Toronto, Singapore: John Wiley & Sons, Inc. p. 801-802.
- ^ Weygandt, J. J., Kieso, D. E., & Kell, W. G. (1996). Accounting Principles (4th ed.). New York, Chichester, Brisbane, Toronto, Singapore: John Wiley & Sons, Inc. p. 800.
- ^ Groppelli, p. 440; Williams, p. 640.
- ^ a b c Groppelli, p. 441.
- ^ a b Groppelli, p. 446.
- ^ Groppelli, p. 449.
- ^ a b Groppelli, p. 447.
1 comment:
[url=http://swisswatches24.co.uk/]Replica Breitling[/url]
nordstrom rack
rolex yachtmaster ii swiss replica
grade 1a swiss replica watches
cheap watches
best rolex replicas swiss made
http://alwaysbestoffer.co.uk/
Post a Comment