Interest Rate Trends
Three month, one year, three year and long-term trends of national average mortgage rates
on 30-, 15-year fixed, 1-year (CMT-indexed) and 5/1 combined adjustable rate mortgages;
historical performance of the National Average Contract Mortgage Rate.
on 30-, 15-year fixed, 1-year (CMT-indexed) and 5/1 combined adjustable rate mortgages;
historical performance of the National Average Contract Mortgage Rate.
| Historical Graphs For Mortgage Rates |
Three Month Trends: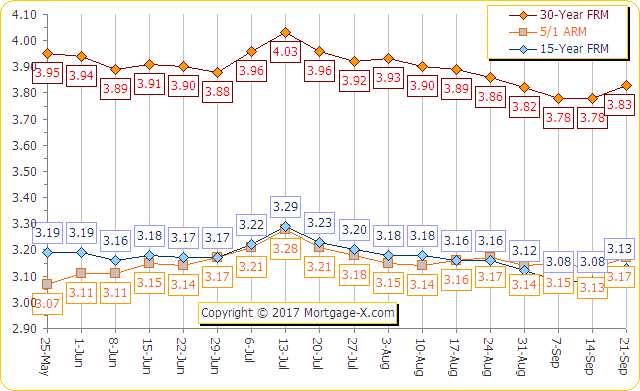 { Obtaining Permission to Reproduce } { Obtaining Permission to Reproduce } |
One Year Trends: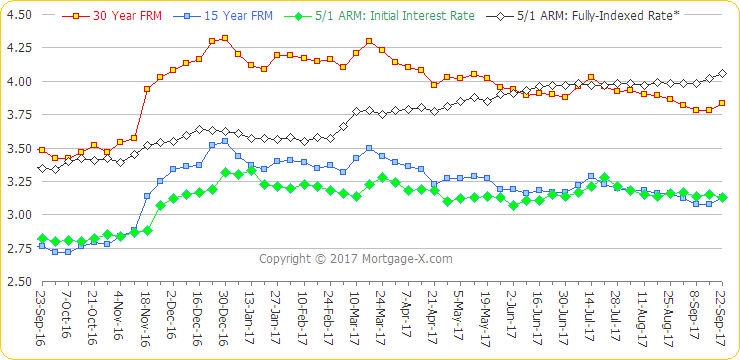 One year trends of mortgage rates: 30-Year FRM, 15-Year FRM, 5/1 ARM, 1-Year ARM* Fully-Indexed Rate = index (1-year CMT) + margin (assuming a 2.75% margin) { Obtaining Permission to Reproduce } |
Three Year Trends: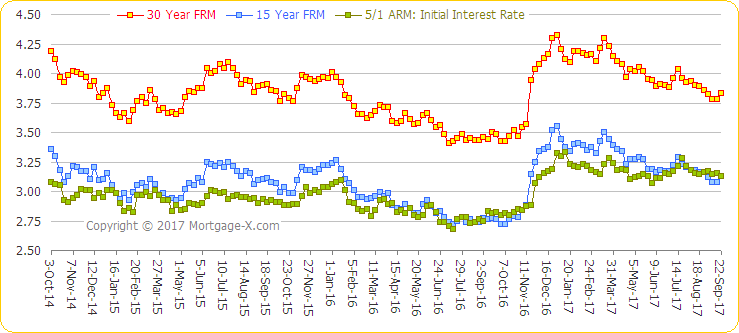 Three year trends of mortgage rates: 30-Year FRM, 15-Year FRM, 1-Year ARM* Fully-Indexed Rate = index (1-year CMT) + margin (assuming a 2.75% margin) { Obtaining Permission to Reproduce } |
| Historical Graphs For Mortgage Rates: Long-Term Trends |
30-Year FRM, 15-Year FRM, 1-Year ARM Rates, 1992 - 2012: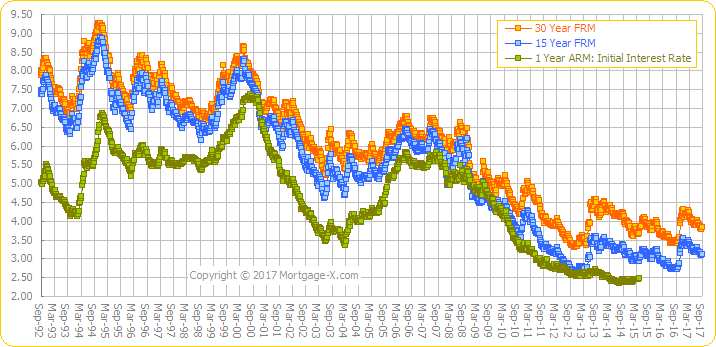 { Obtaining Permission to Reproduce } |
30-Year FRM, 15-Year FRM Rates 1984 - 2012: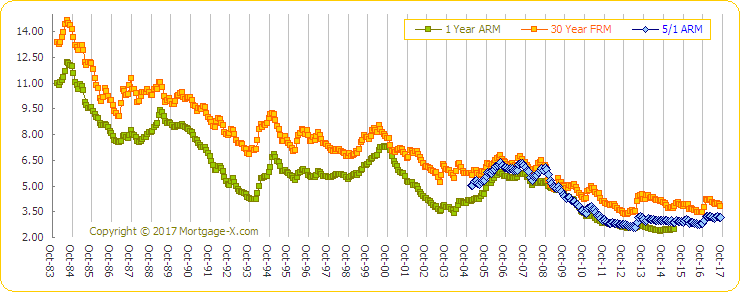 { Obtaining Permission to Reproduce } |
30-Year FRM Rates 1971 - 2012: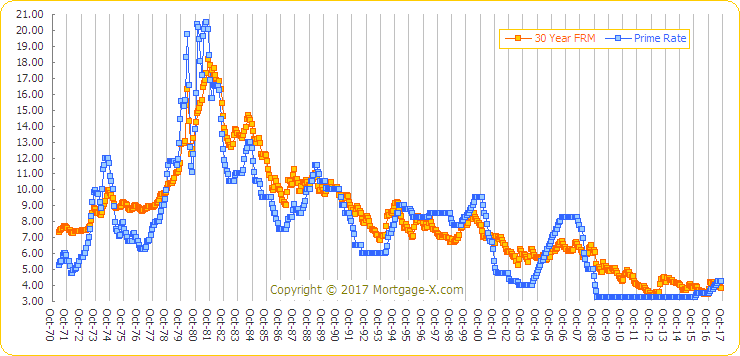 { Obtaining Permission to Reproduce } |
| Historical performance of the National Average Contract Mortgage Rate |
National Average Contract Mortgage Rate, 1963 - 2012: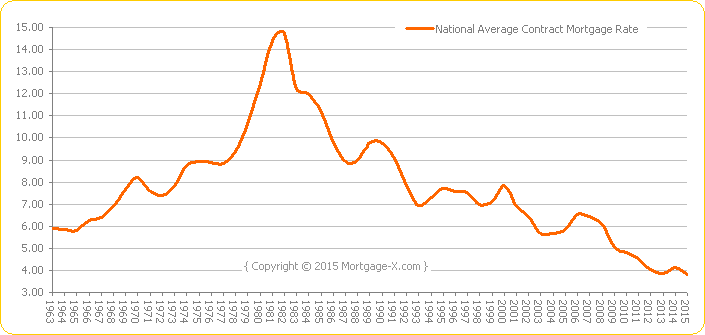 { Obtaining Permission to Reproduce } |
No comments:
Post a Comment