How To Trace SOAP Message In Eclipse IDE
In SOAP web service, each HTTP request or response encapsulates a SOAP envelope, these messages are easy to trace by using Eclipse IDE, build-in “TCP/IP monitor” tool. The idea is host another server in between the client and server to perform port forward function to intercept the HTTP traffic.
1. Normal SOAP envelope flows
In normal SOAP service, client send a HTTP request to server, and server send back a HTTP response to client directly.
1. Client ----> SOAP envelope ----> Server:9999

2. Server:9999 ----> SOAP envelope ---> Client
2. Intercepted SOAP envelope flows
To intercept SOAP envelope, you can host another server (“TcpMonitorServer”) in between client and server, see new flows :
1. Client ----> SOAP envelope ----> TcpMonitorServer:8888

2. TcpMonitorServer:8888 --> SOAP envelope ---> Server:9999

3. Server:9999 ----> SOAP envelope ---> TcpMonitorServer:8888

4. TcpMonitorServer:8888 ----> SOAP envelope ---> Client
Note
This method required port changed in your web service client.
This method required port changed in your web service client.
Eclipse IDE + TCP/IP Monitor
Eclipse IDE comes with a very easy to use traffic interceptor tool, known as “TCP/IP Monitor“. In this tutorial, we show you how to enable this “TCP/IP Monitor” in Eclipse IDE, and also intercept the SOAP messages generated by web service.
Here’s the steps to enable “TCP/IP Monitor” in Eclispe IDE.
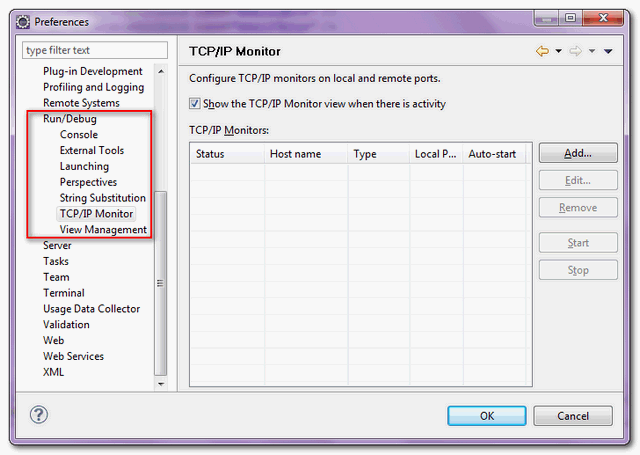
1. In IDE, access Windows –> Preferences –> Run/Debug –> TCP/IP Monitor

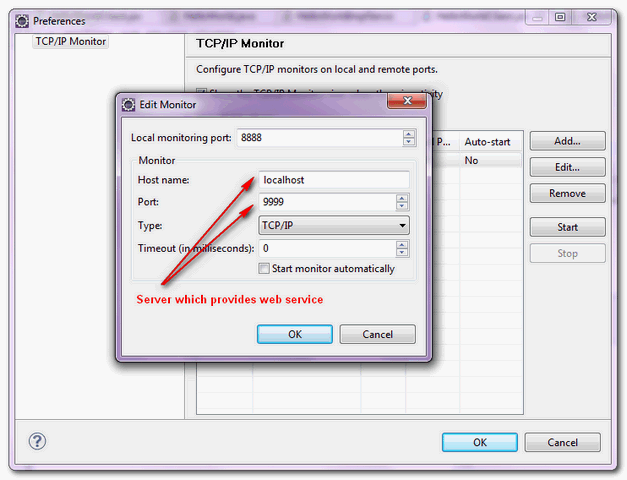
2. Fill in server information, and choose type = “TCP/IP”

3. Click on the “start” button to start tracing the web service traffic.

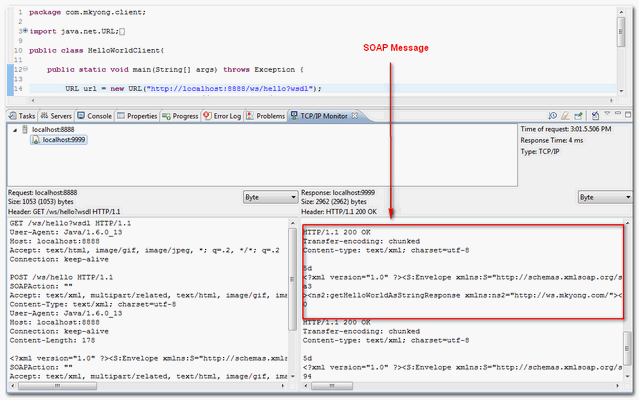
4. Show the traced messaged in the “TCP/IP Monitor” view if any.

Note
You can copy this JAX-WS web service example and do the testing yourself.
You can copy this JAX-WS web service example and do the testing yourself.
For Netbean users
In Netbean IDE, you can use TCP monitor to trace SOAP message.
In Netbean IDE, you can use TCP monitor to trace SOAP message.
Tags : eclipse jax-ws soap web services
No comments:
Post a Comment